Custom Dashboards - Crowdstrike
During a contract at CrowdStrike, I led the design of a new dashboard builder to help security teams quickly visualize operational metrics in one place.
The problem
Existing dashboards were rigid and difficult to customize, forcing analysts to export data and build charts offline, consuming up to 40% of their time and delaying insight across teams.
What I delivered
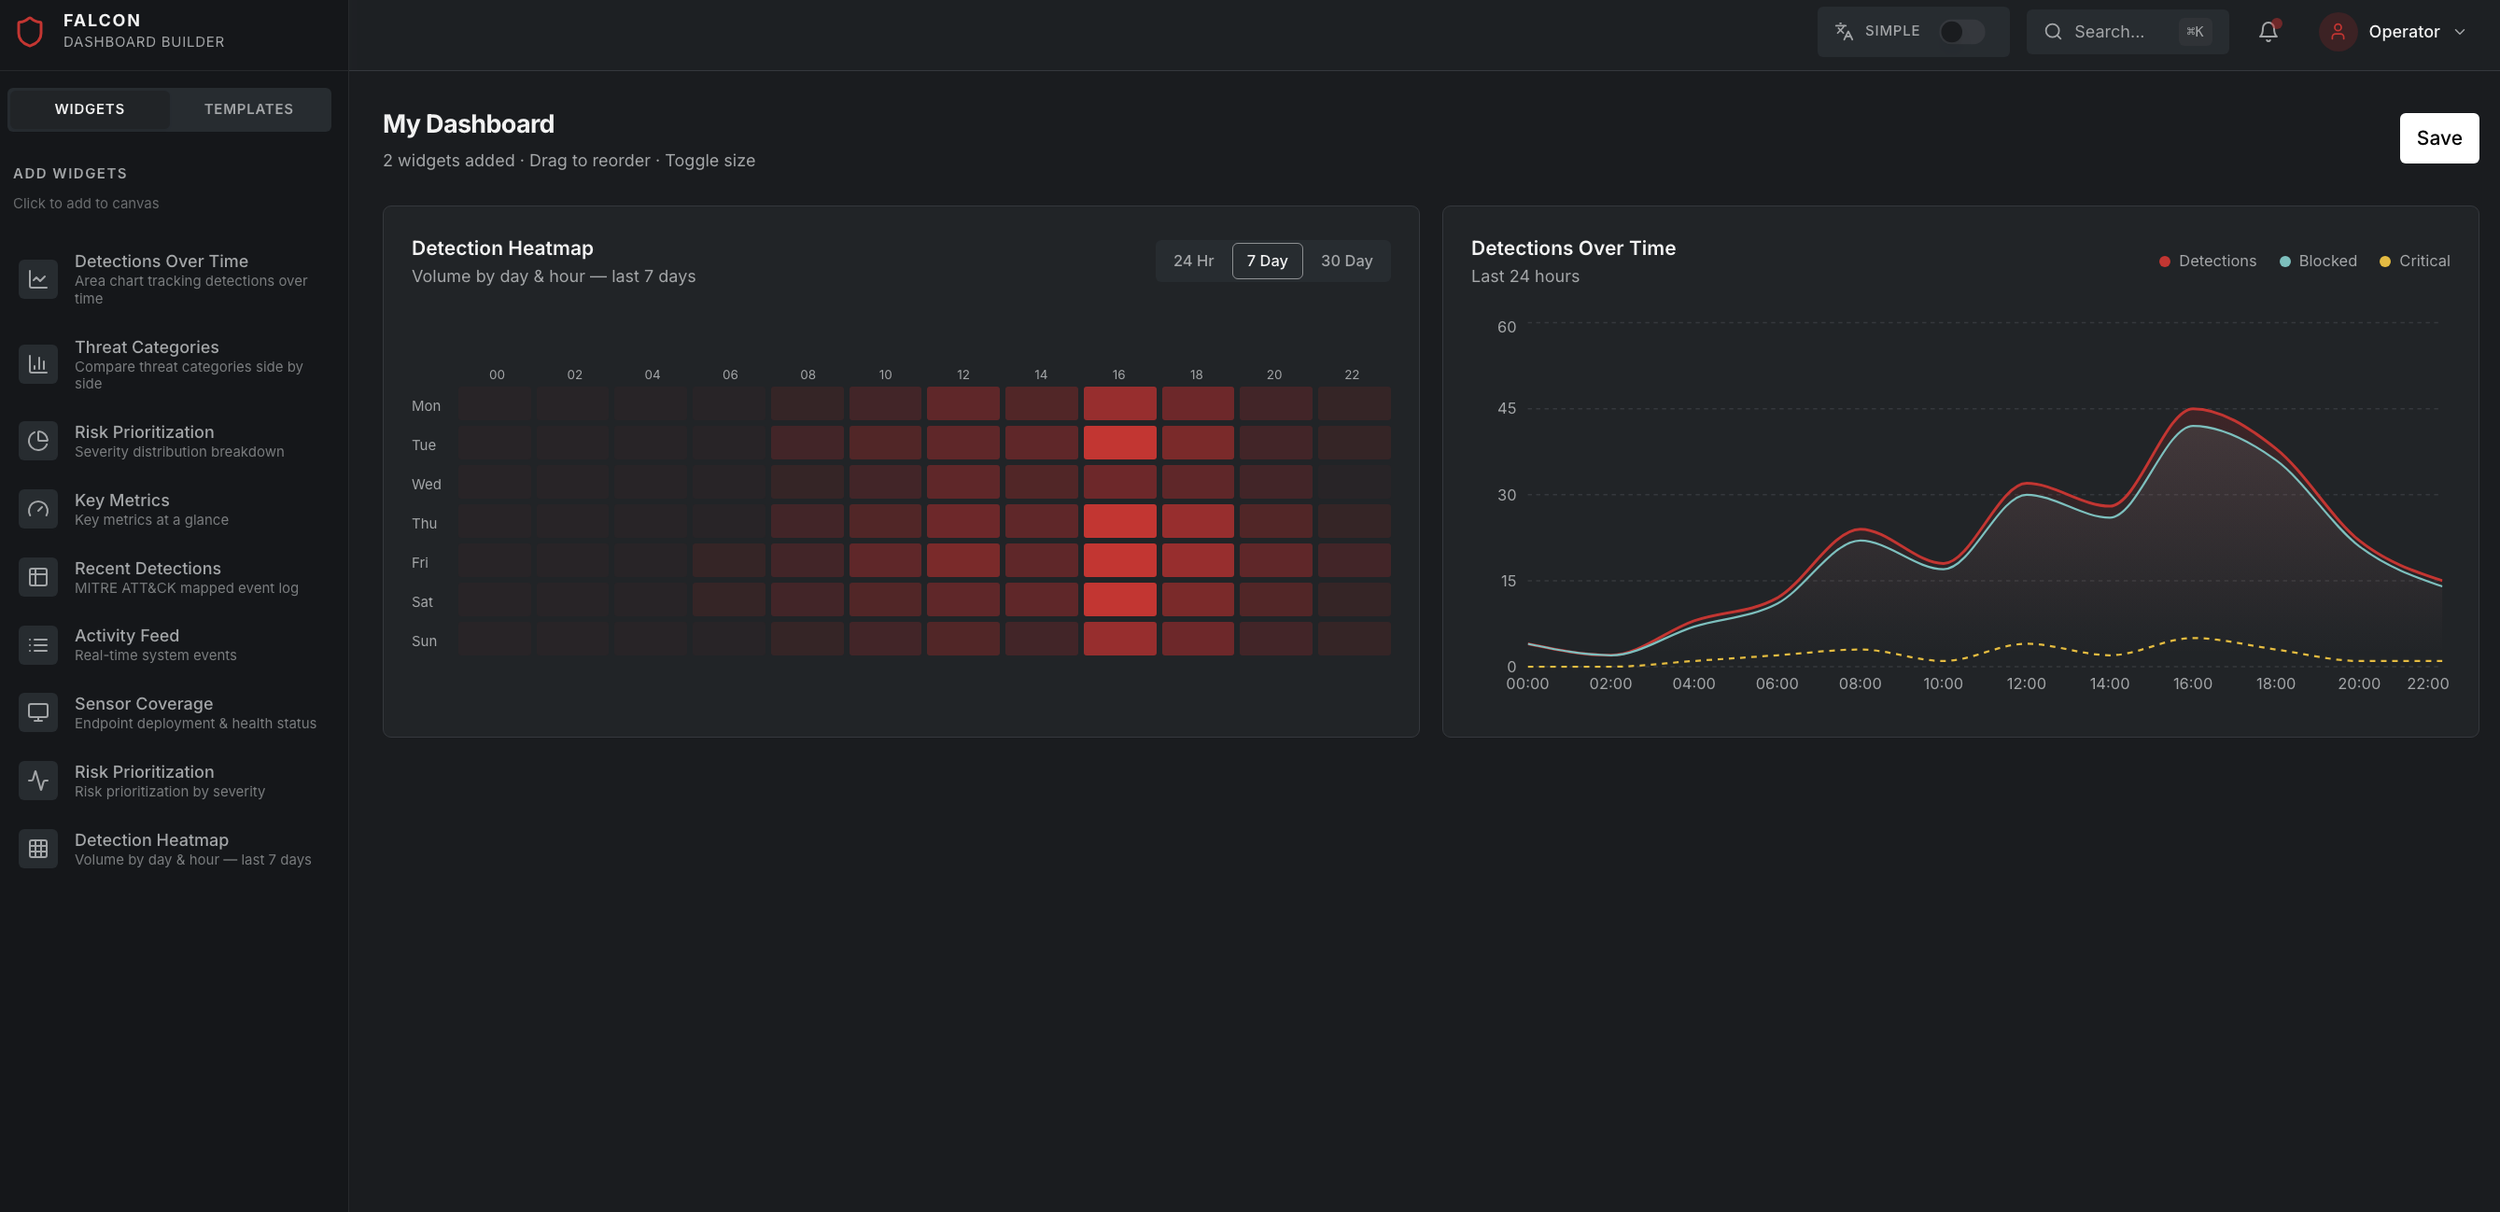
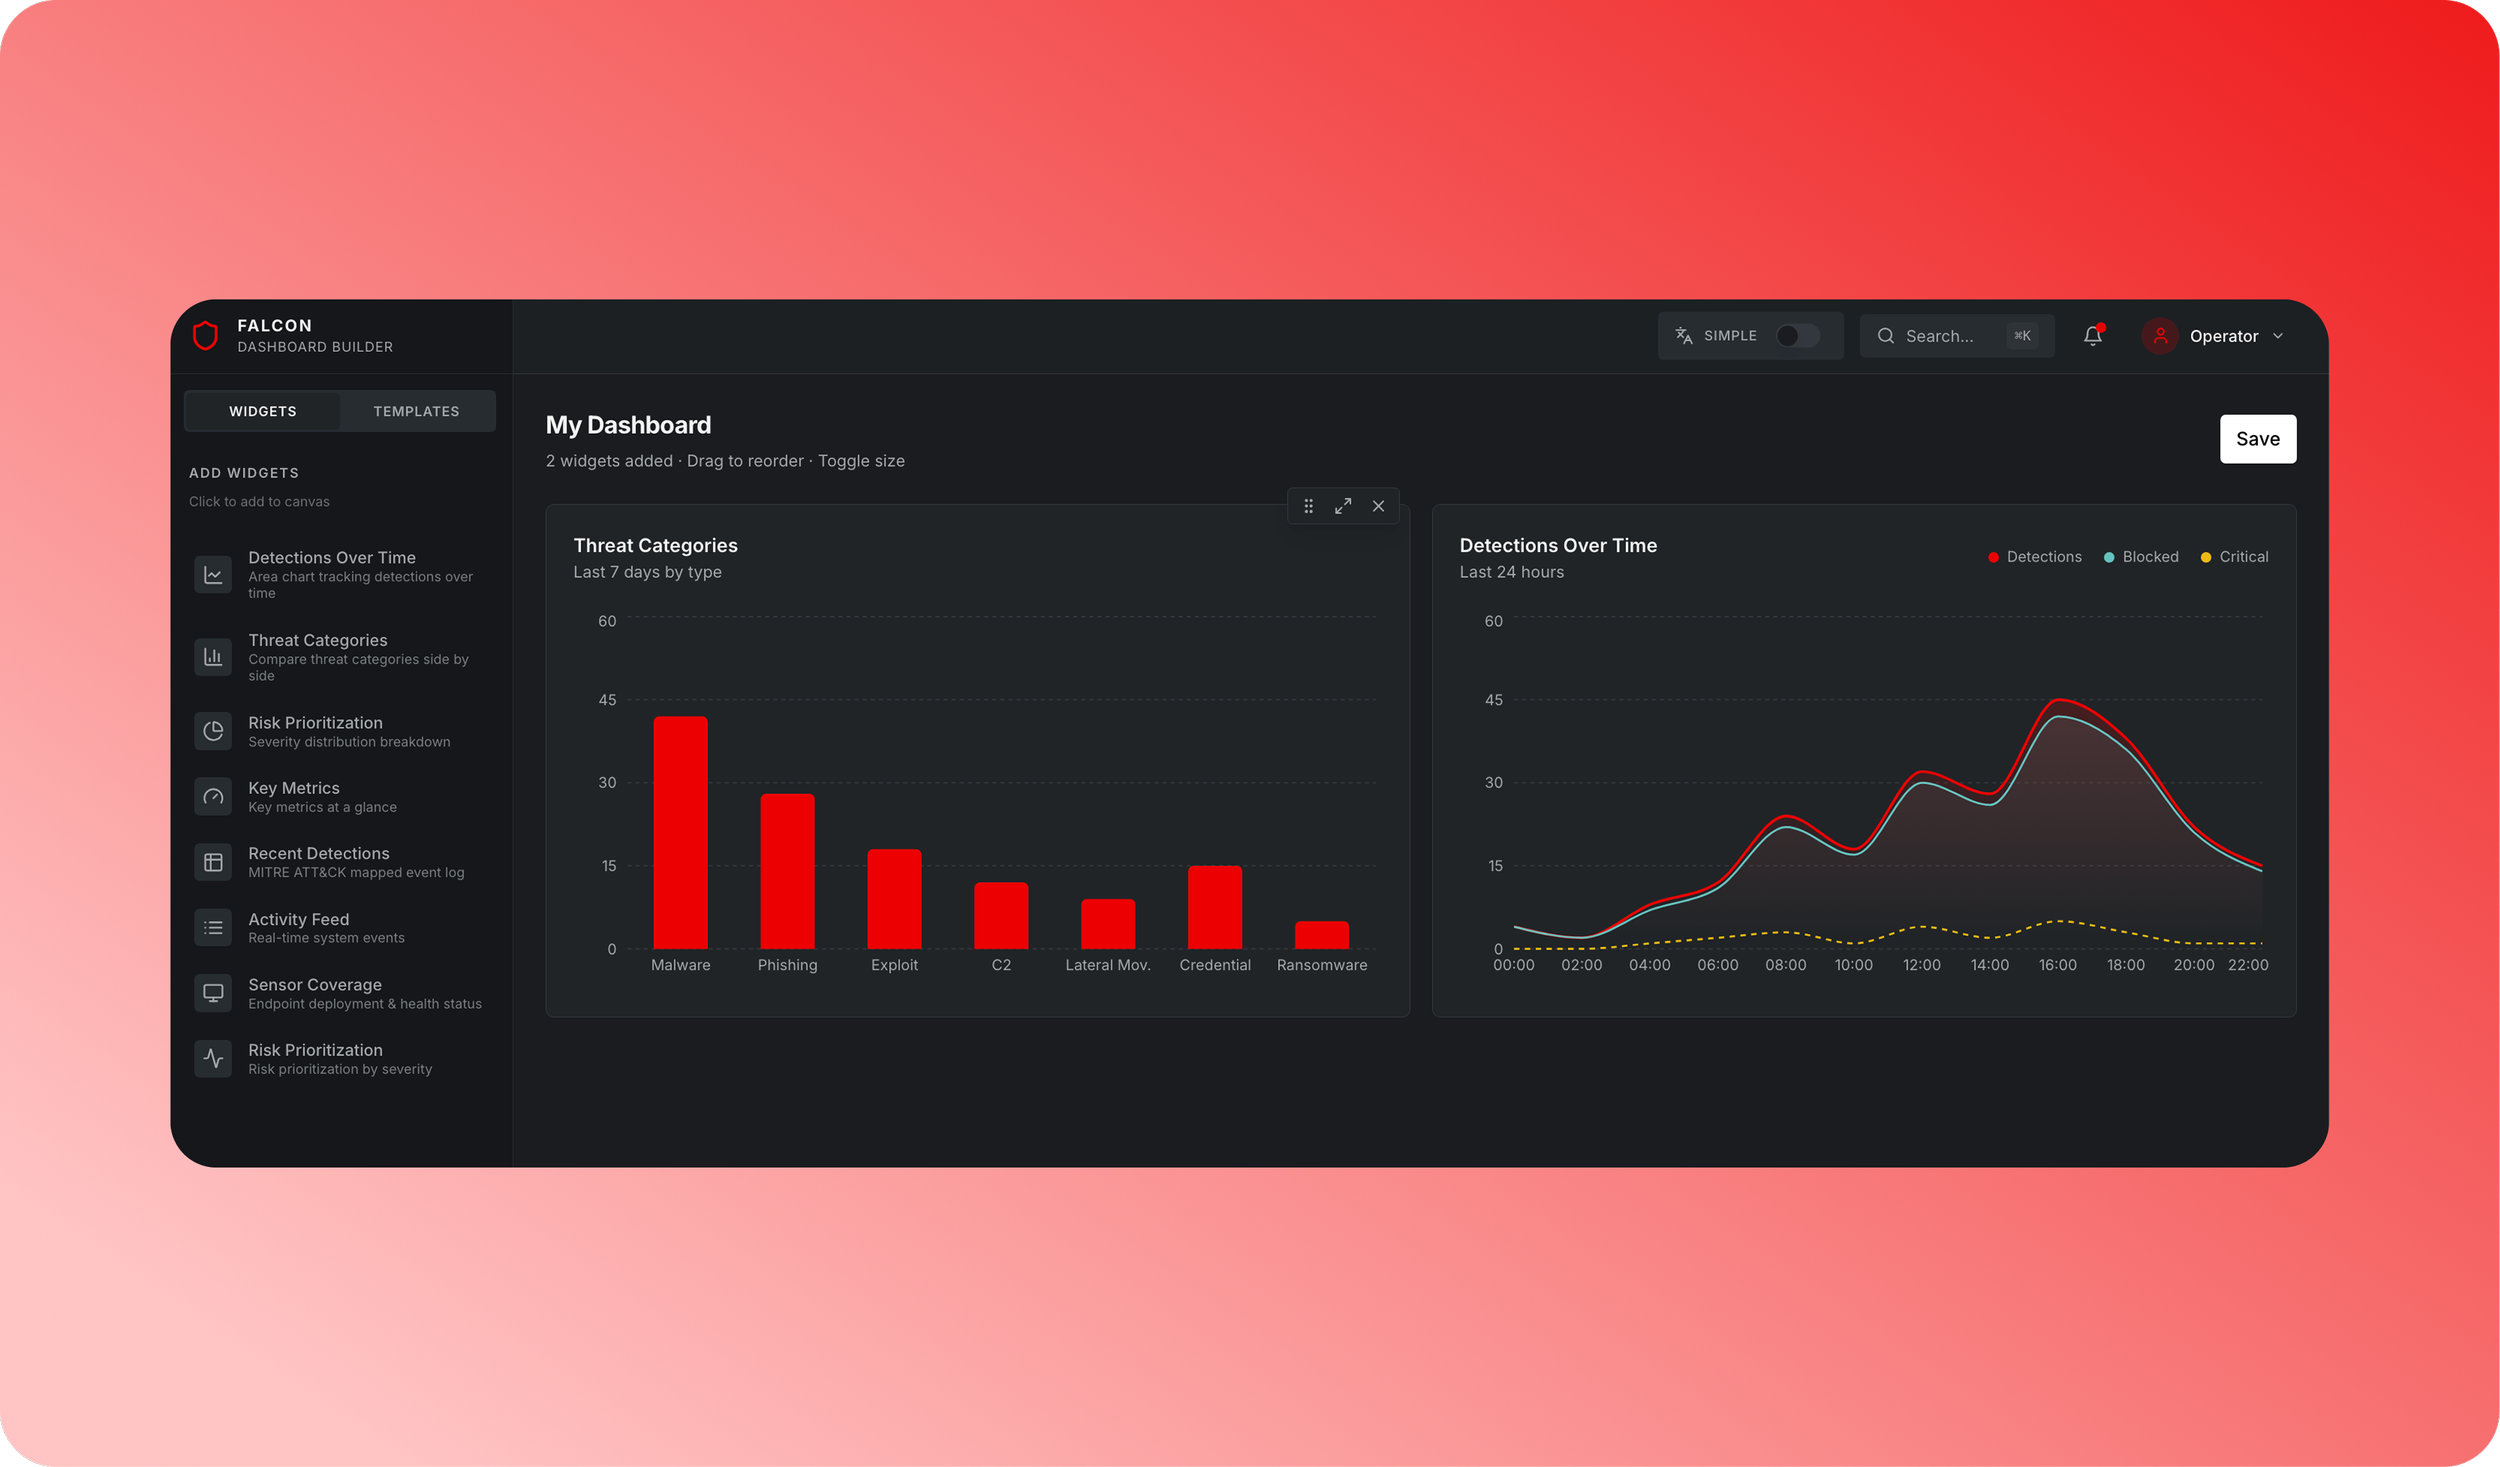
I designed a 0→1 dashboard builder that enabled analysts to assemble configurable, reusable widgets in minutes.
Key design contributions included:
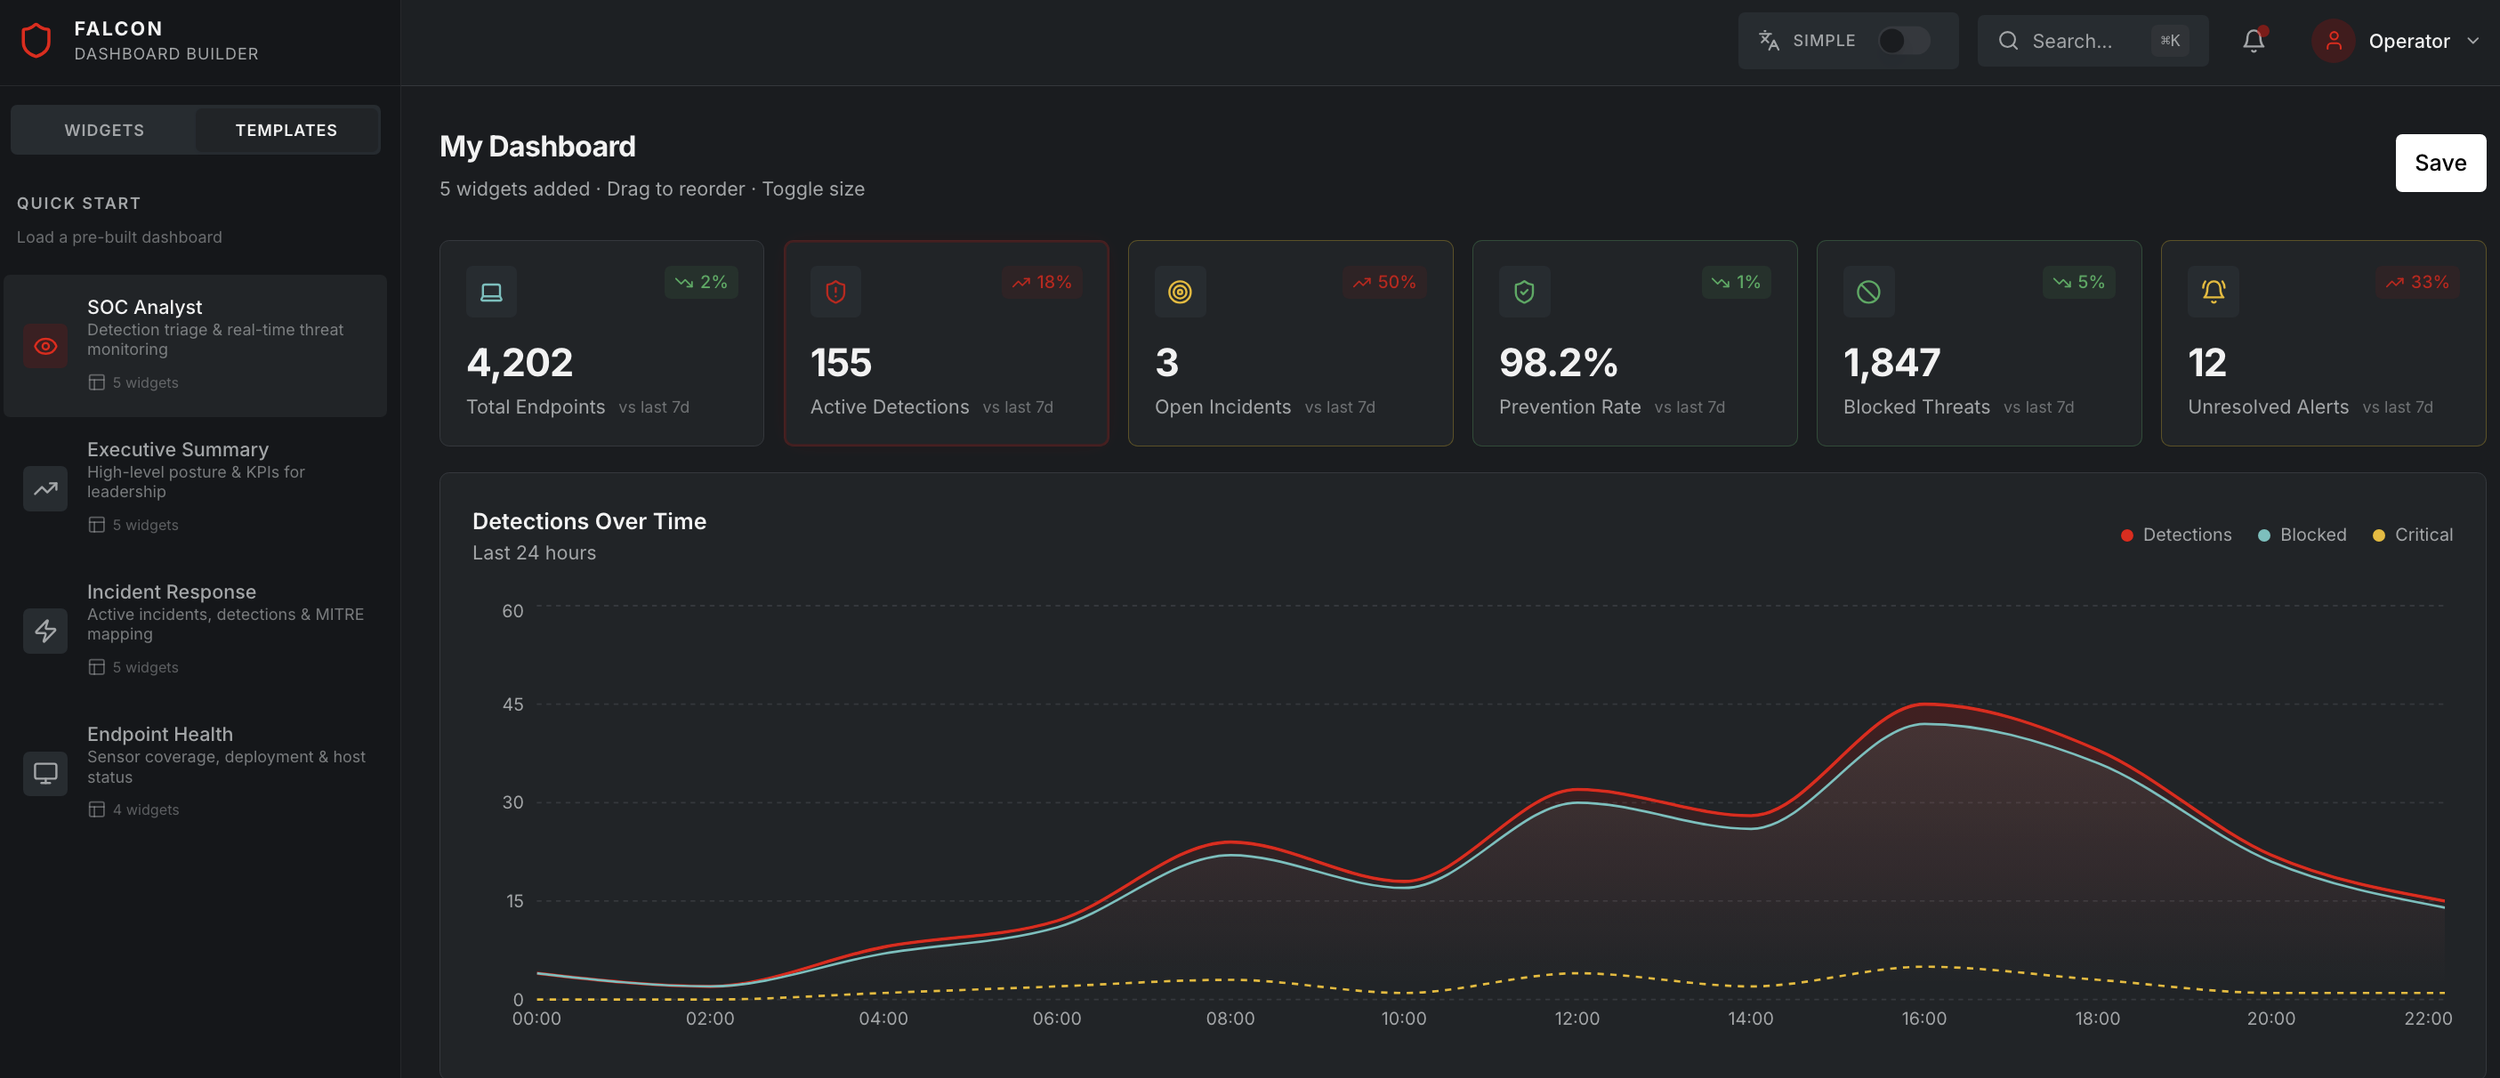
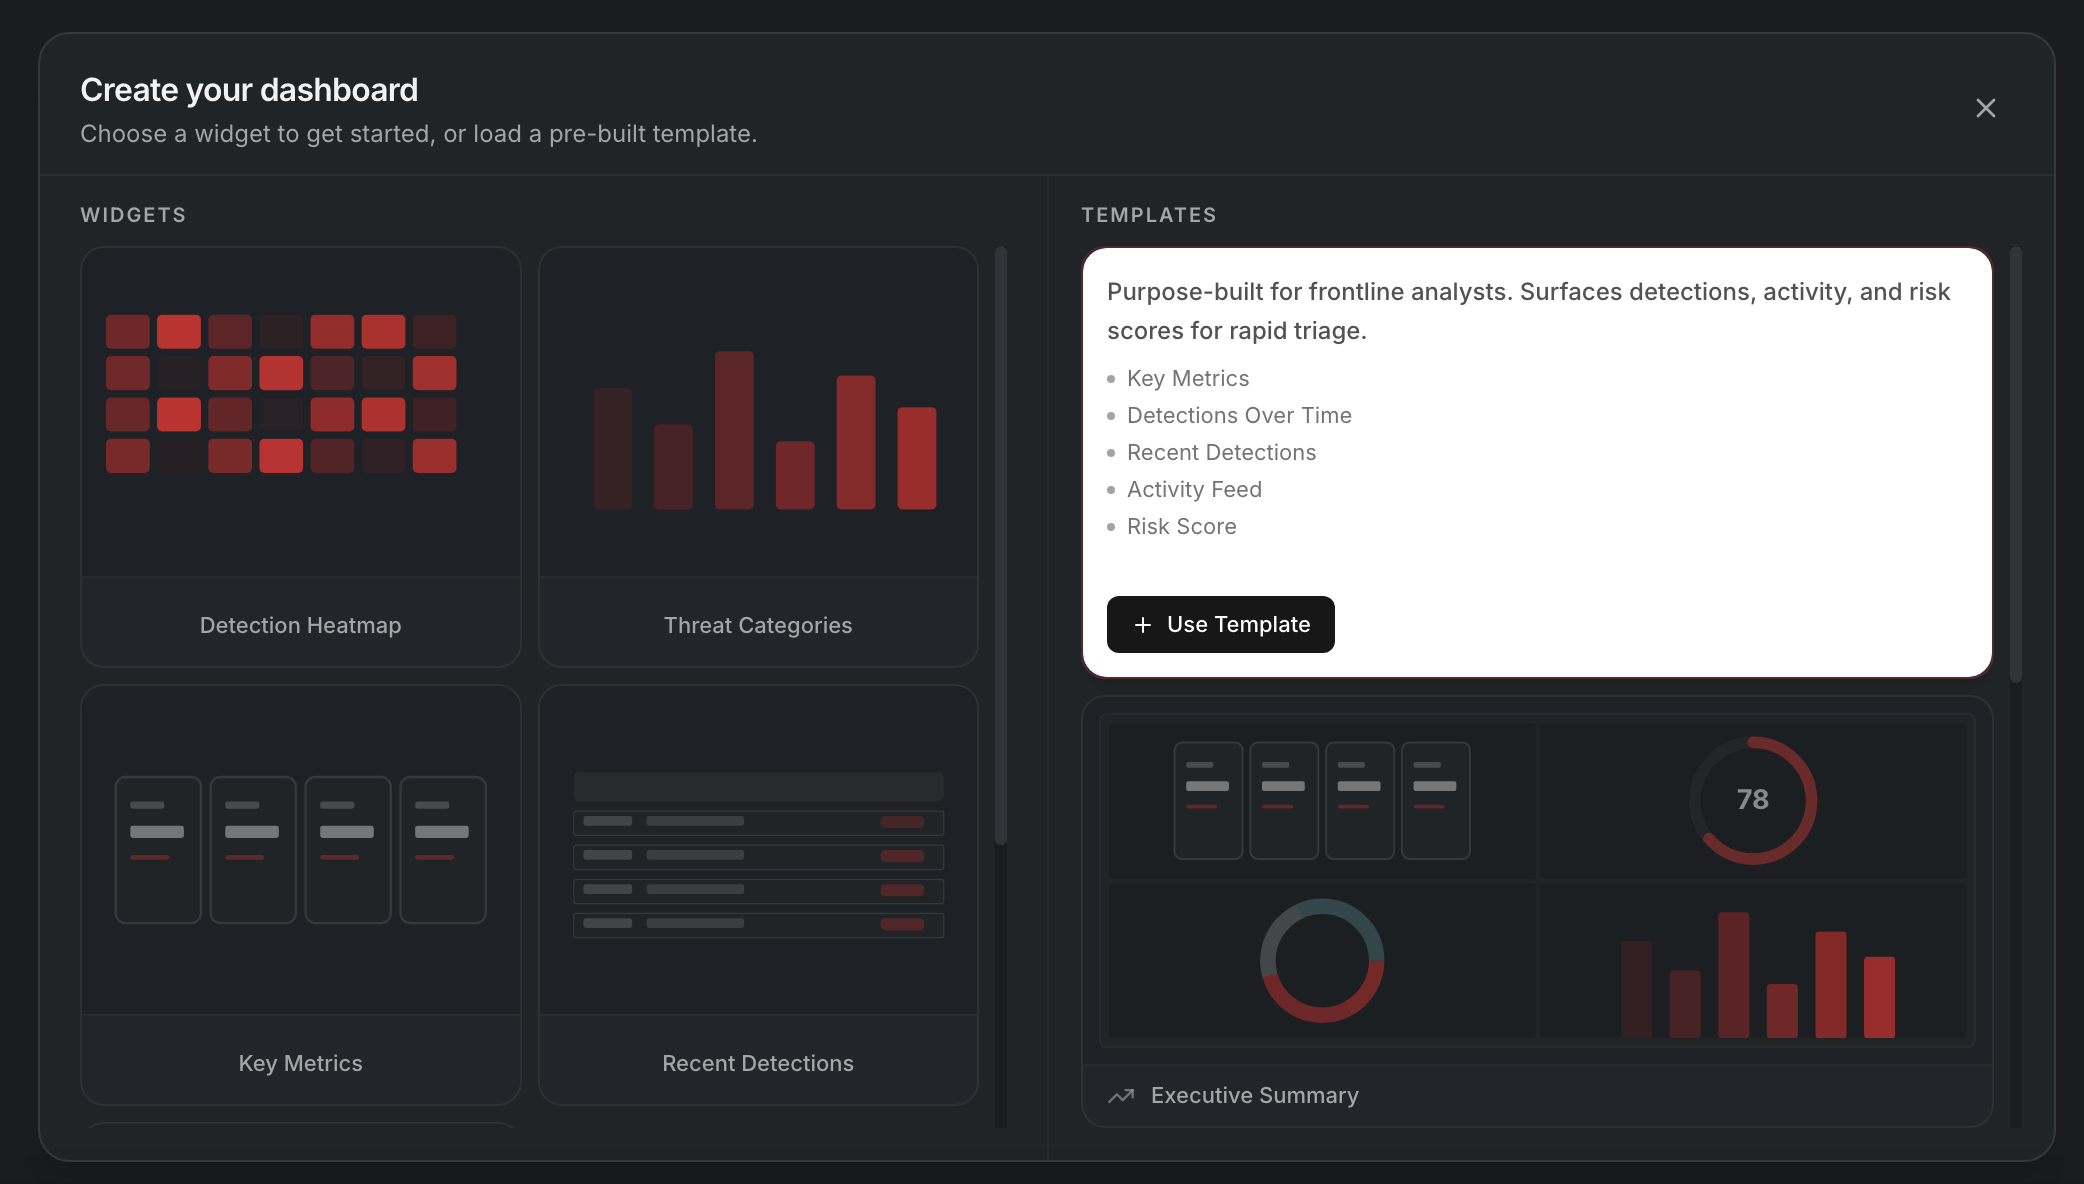
Intent-based widgets aligned to SOC workflows (e.g., detections, techniques, coverage)
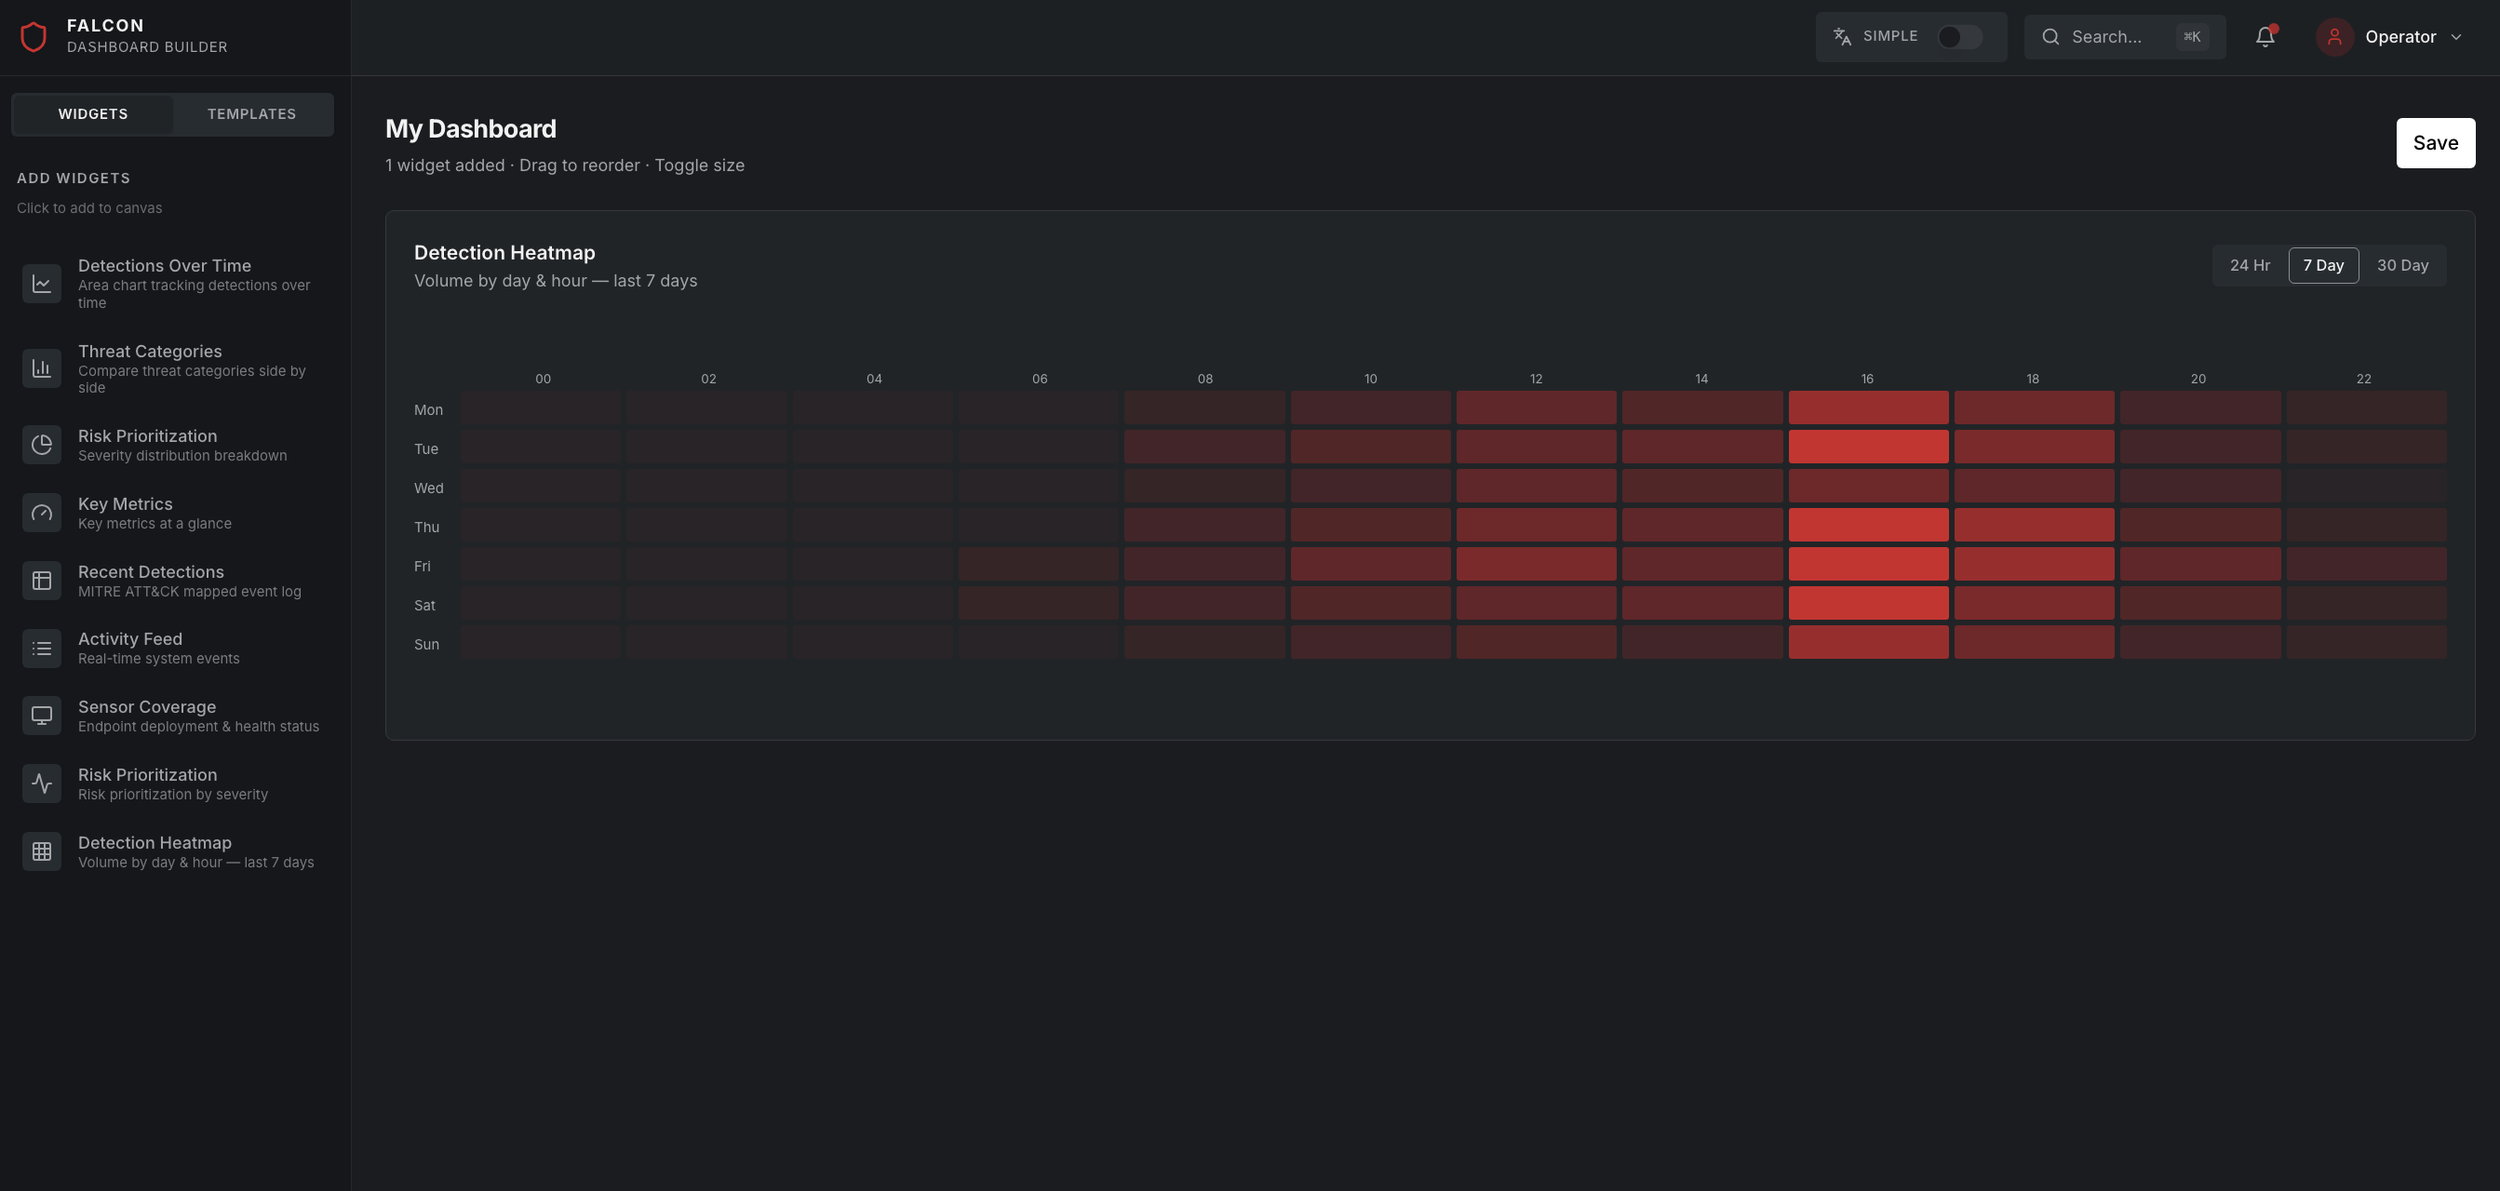
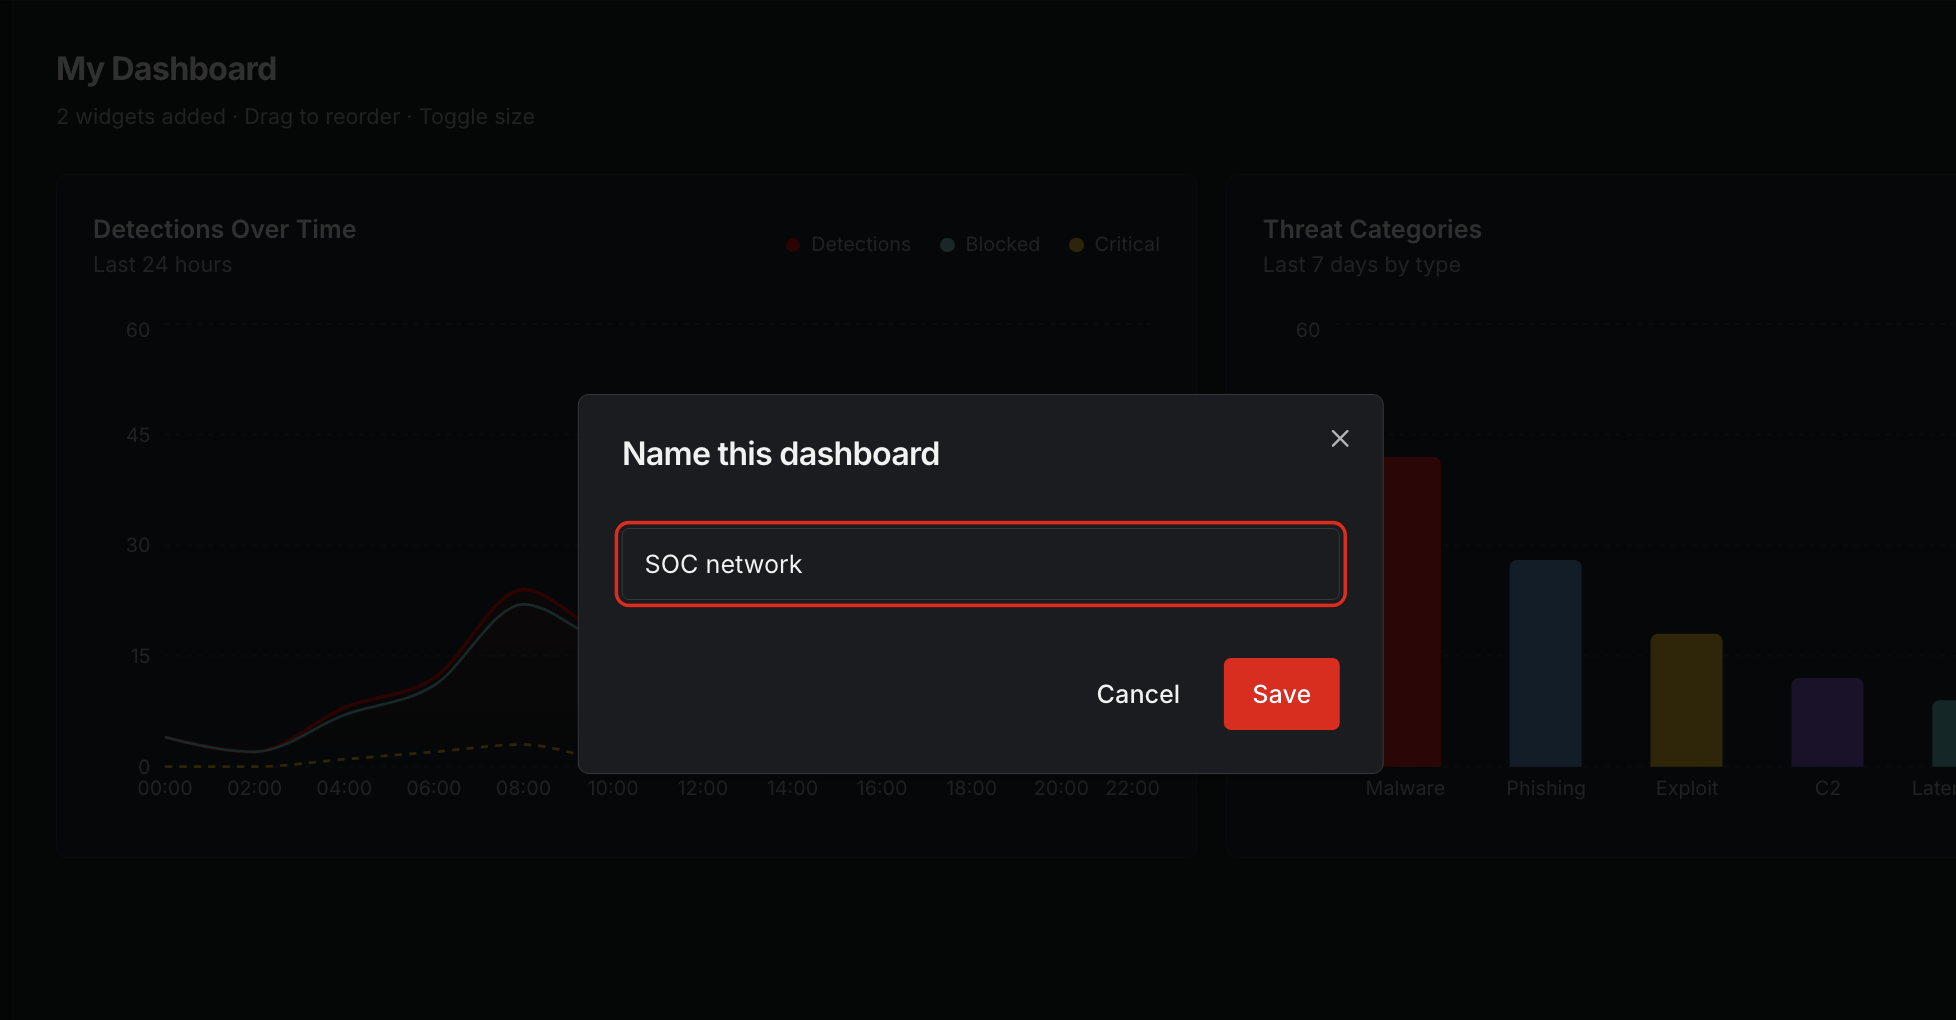
Drag-and-drop canvas with quick-start templates
Insight-first terminology and streamlined workflows
Interaction patterns optimized for high-pressure review contexts
Scalable, metadata-driven widget system for performance and extensibility
Impact
3× faster dashboard creation
29% increase in saved dashboards
Dashboards became the operational source of truth across teams
Analysts reported significantly improved clarity, faster decision-making, and reduced cognitive load.